Blog

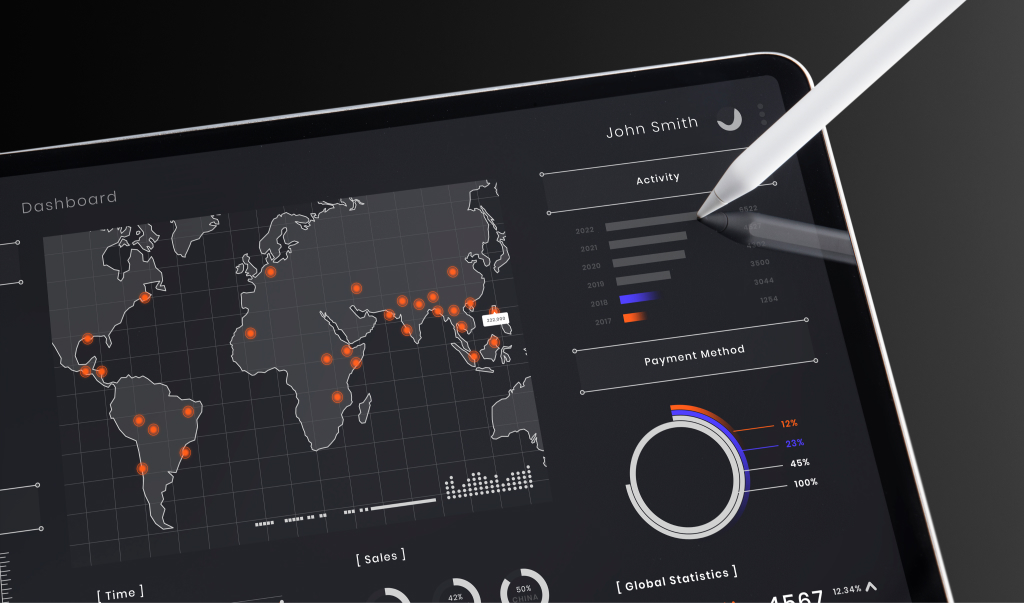
In the Digital Age, our ability to understand and communicate through visual storytelling stands paramount. Data Visualization isn't just about pretty graphics; it's the art and science of turning abstract data into comprehensible images, charts, or graphs. This transformation provides an immediate view of complex ideas, making data accessible to both analytical minds and the general populace. It equips businesses with the tools to turn vast volumes of seemingly unintelligible numbers into actionable insights.

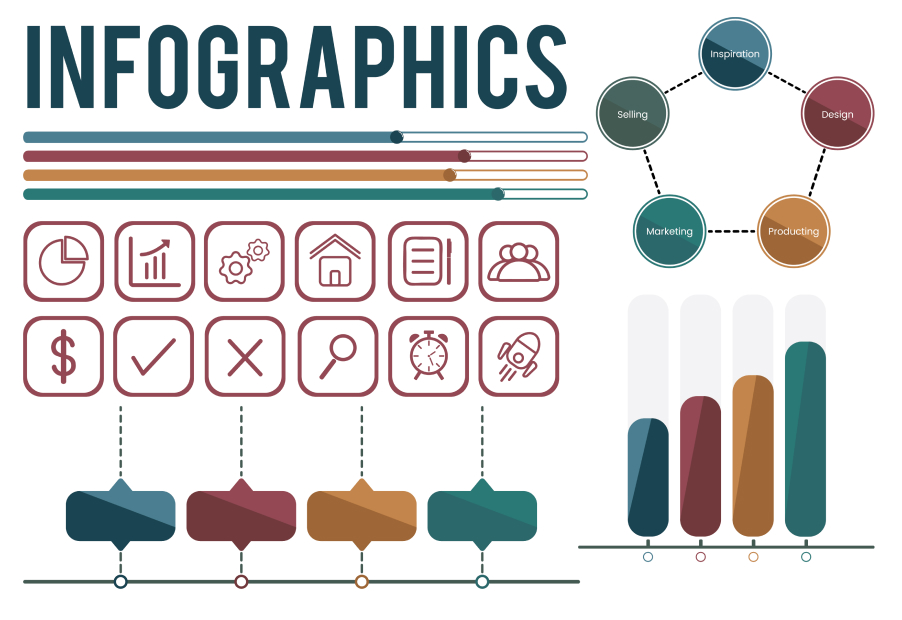
Have you ever scrolled past an eye-catching visual online, only to be drawn back by its vibrant colors and engaging presentation of information? The irresistible pull that made you stop and click? That's the magic of infographics. These data-driven visual narratives are changing the way we consume information, making even the most complex data digestible and engaging.